

[ Sectors ]
Built for the people who build and fund AI and energy infrastructure.
Engineering teams use Thinking Lab™ to get from first site visit to a buildable design with every assumption visible. Investors use it to know which opportunities are real, what they will cost and what could go wrong, before capital is committed.
[ Two axes, one project ]
Every stage of a capital project, from both sides of the table.
The same world model and the same evidence trail serve the engineers who build the answer and the investors who have to sign it off.
Engineering teams
Investors
01Screen
Engineering teams
Screen sites on terrain, grid access, flood and land constraints in one pass.
Investors
Rank markets and opportunities before paying for studies.
02Assess feasibility
Engineering teams
Cut/fill, drainage, geotechnical and seismic screening before a borehole is drilled.
Investors
Fatal-flaw screening across zoning, flood, geotech, grid and title.
03Design & permit
Engineering teams
Corridor routing, permit-trigger matrix and CAD/DXF deliverables.
Investors
Interconnection and permitting timelines priced into the schedule.
04Invest & finance
Engineering teams
Cost-driving risks quantified with confidence intervals for the model.
Investors
NPV, IRR and sensitivity on sourced assumptions; lender-ready evidence.
05Build & operate
Engineering teams
Satellite change detection for construction progress and asset condition.
Investors
Portfolio monitoring, hazard exposure and regulatory evidence.
One shared world model · One evidence trail
[ For engineering teams ]
From first site visit to a buildable design, with every assumption visible.
Owner's engineers, EPC and design teams and technical advisors delegate the analysis a whole discipline team would run, and get sourced, CAD-ready outputs back.
Who
- Owner's engineers
- EPC and design teams
- Technical advisors
- Utility and grid planners
Example questions
- Compare three 400 kV corridors and count every wetland crossing.
- Estimate cut and fill for the plant pad and flag drainage conflicts.
- Which permits will this site trigger, and which agency owns each one?
Worked examples
What engineering teams run on Thinking Lab.
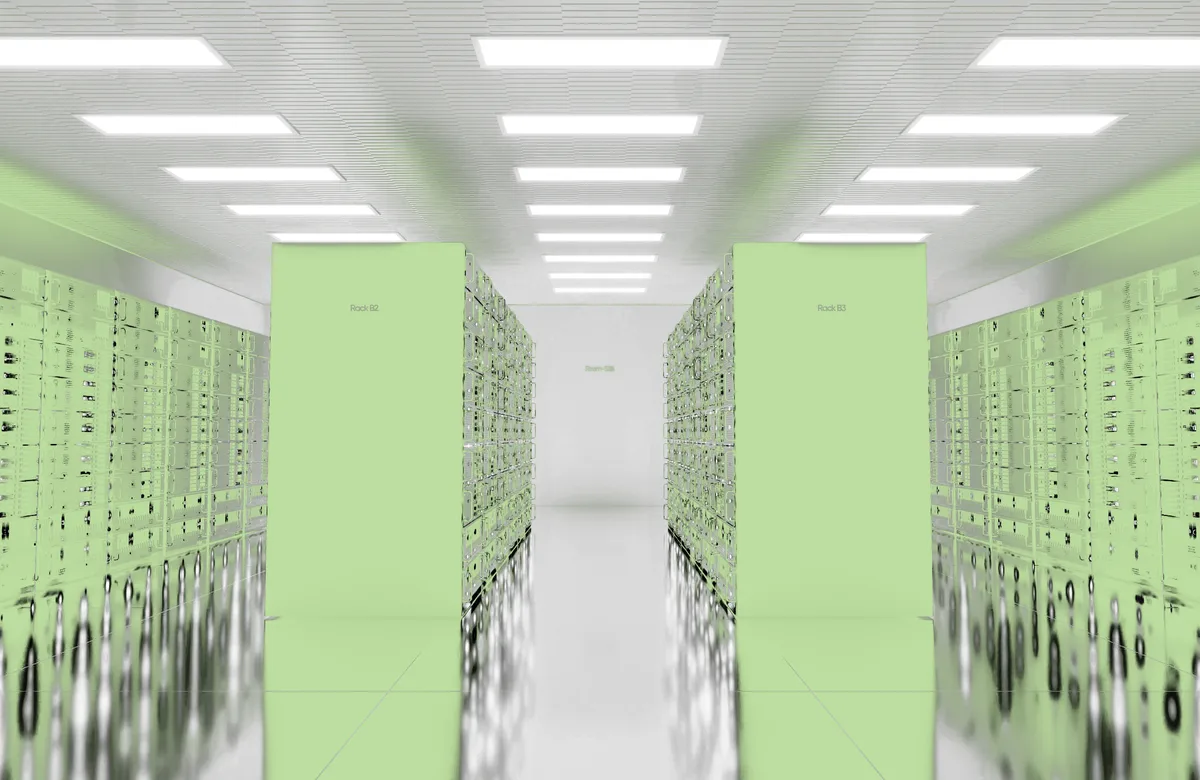
Siting · Data centres
Hyperscale data centre siting
Power first: grid stress, queue depth and time-to-power, then cooling water, latency, flood and seismic.
Grand Est: 36 candidate sites screened and ranked in hours.
- Grid headroom
- Cooling water
- Latency
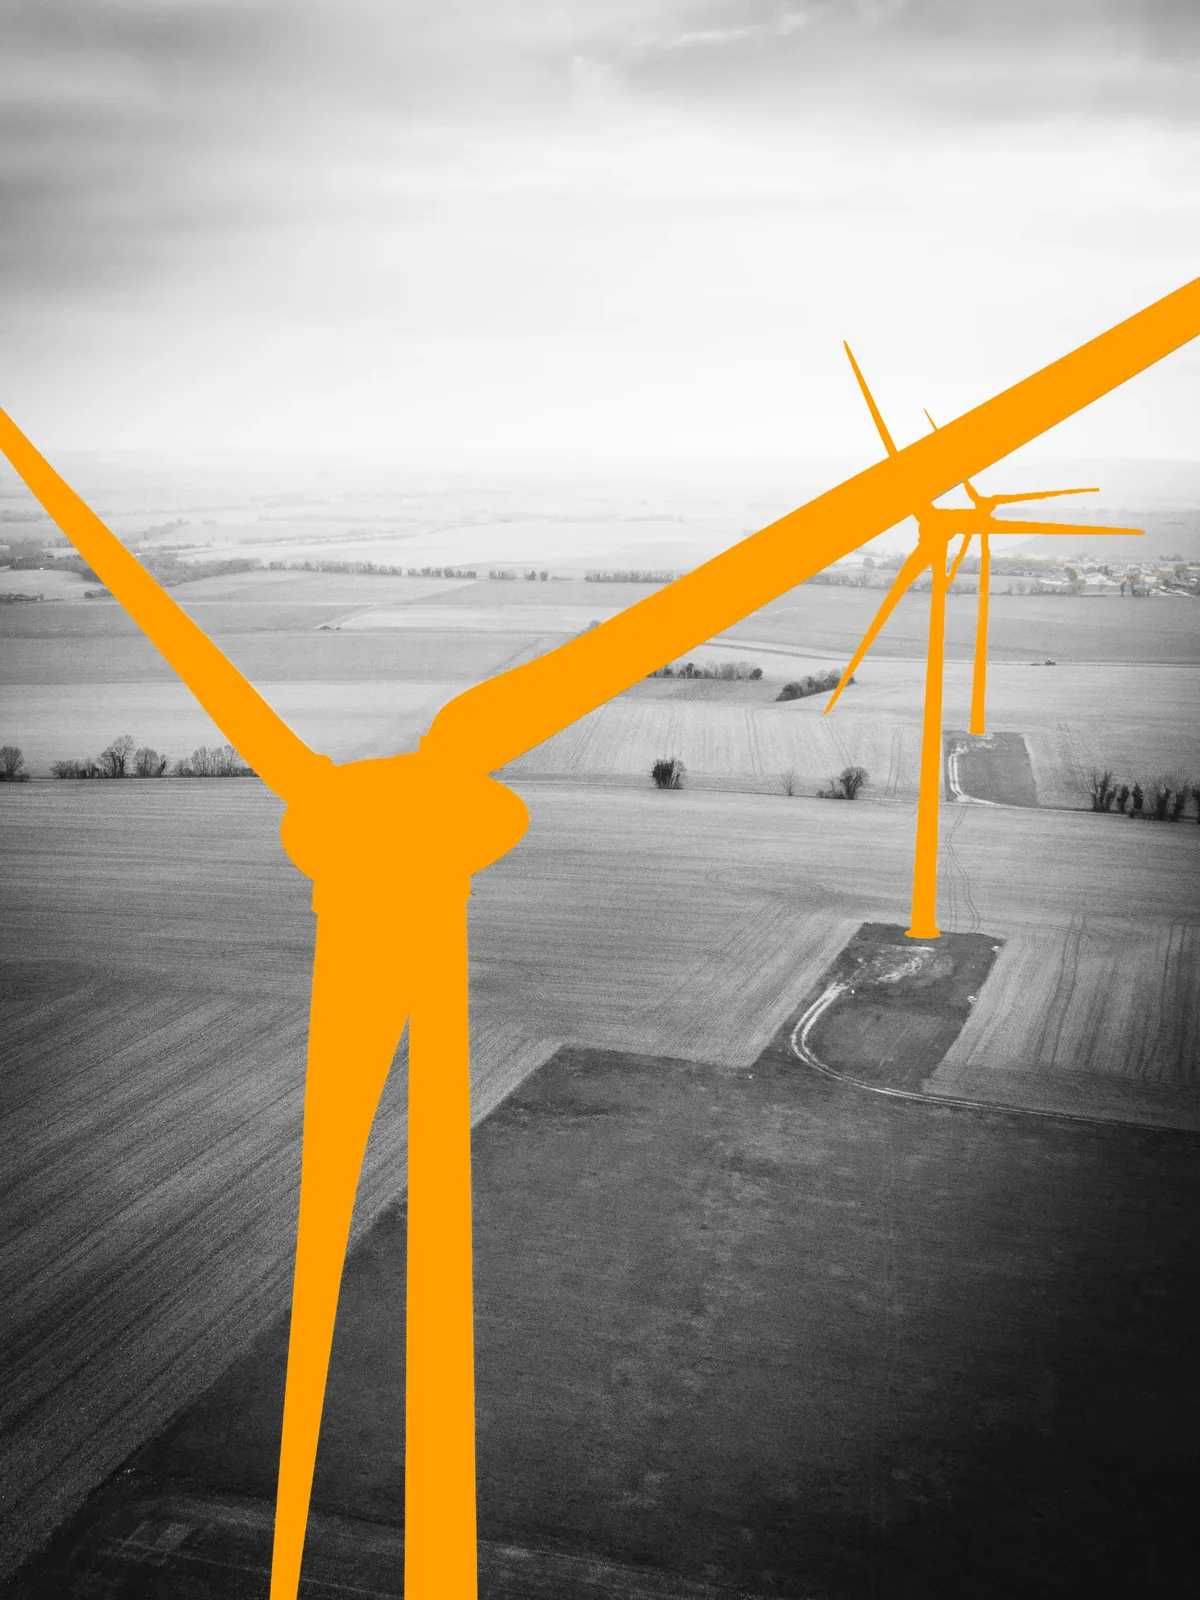
Renewable energy · Wind
Onshore and offshore wind farms
Wind resource, setbacks and habitat, roads for turbine transport and grid connection; bathymetry and shipping lanes offshore.
- Wind resource
- Setbacks
- Grid access
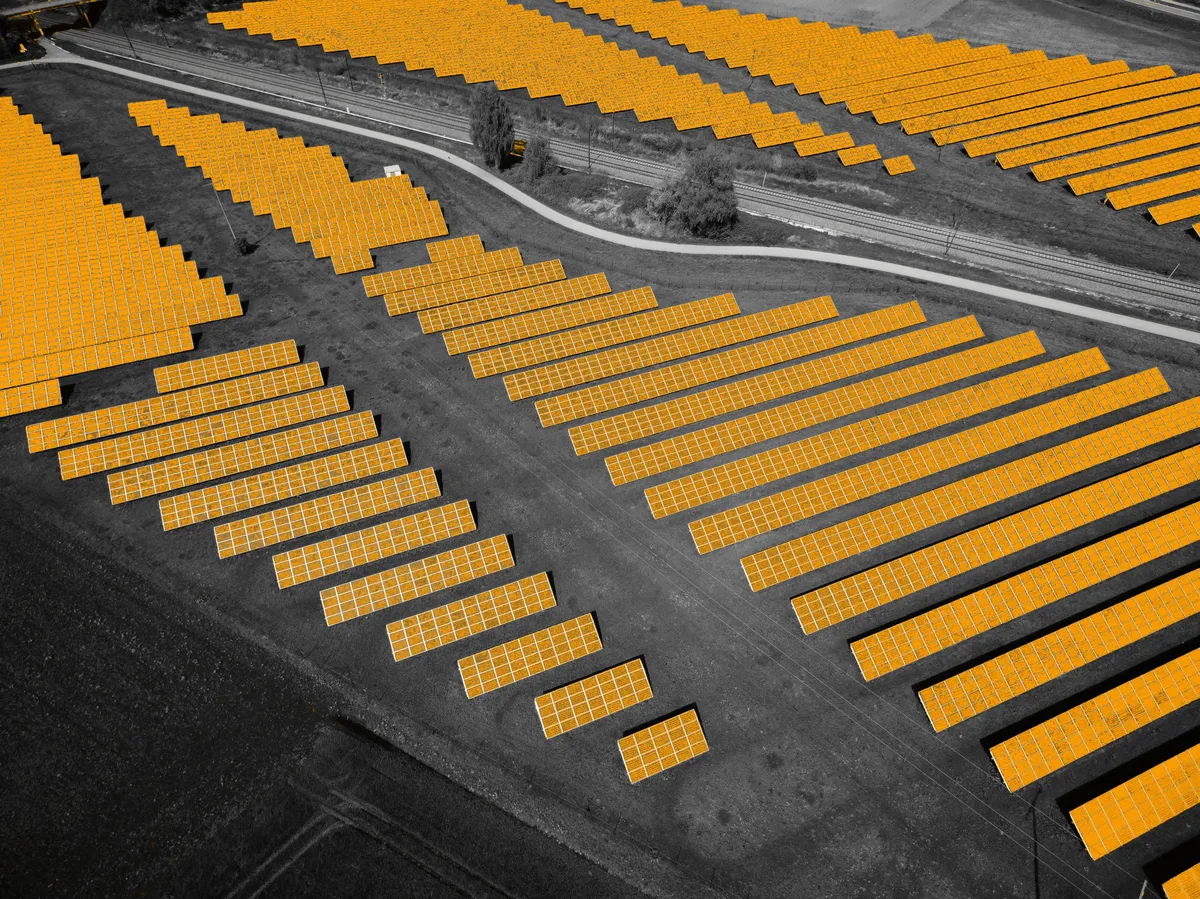
Renewable energy · Solar
Utility-scale solar farms
Irradiance, slope, aspect and curtailment risk, with flood-prone and protected land excluded automatically.
- Irradiance
- Slope & drainage
- Curtailment
Renewable energy · Hydropower
Hydropower and pumped storage
Head and flow from the river network; protected waterways, fish habitat and communities downstream screened in the same pass.
- Head & flow
- Watershed
- Downstream receptors
Grid · Transmission
Transmission and gen-tie corridors
Least-cost corridor alternatives across terrain, crossings and parcels; constraint crossings counted per route; substation access at both ends.
- Corridor routing
- Crossings
- Parcel exposure
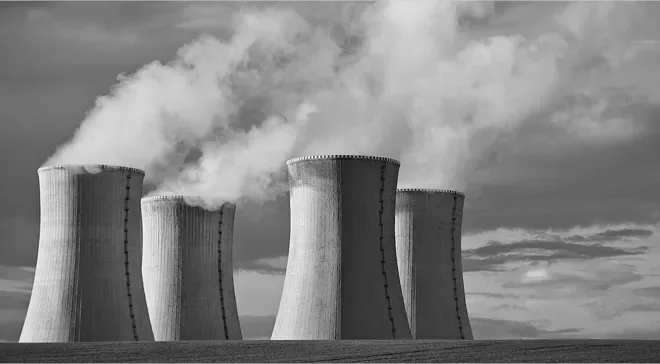
Power · Nuclear & thermal
Power plant and nuclear siting
Cooling water from rivers and lakes, seismic and geological hazard, exclusion zones, population distance and grid integration.
- Cooling water
- Seismic
- Exclusion zones
Use cases
01
Elevation, slope and terrain ruggedness from satellite elevation models or your own LiDAR survey; land cover, soil, geology and seismic indicators; parcel ownership, zoning and right-of-way, all in one pass.
02
Cut and fill volumes, grading feasibility against earthwork budgets, and CAD/DXF contour plans, grade surfaces and setback buffers with proper coordinate frames and title blocks.
03
Watersheds, drainage networks and contributing area for any design point; terrain-based flood susceptibility combined with regulatory flood data and 14-day atmospheric forecasts.
04
Least-cost alignments for roads, rail, pipelines, transmission, gen-tie and fibre, with crossing counts, parcel exposure and cut/fill along every alternative.
05
Grid stress, interconnection queue depth and time-to-power; substations, transmission and connection options mapped against demand.
06
Geology, seismic hazard and foundation suitability; water availability, impoundment screening, and drought and flood exposure.
07
Protected areas, wetlands and habitat mapped; a permit-trigger matrix flags likely approvals from the site's actual features, with a source-authority register and explicit data gaps.
08
Satellite change detection tracks construction progress, revegetation, encroachment and surface change across sites and corridors, with no field visit required.
Delivered where engineers already work
- CAD / DXF
- BIM / IFC
- GIS layers
- Reports & tables
- APIs & custom MCP
[ For investors ]
Know which opportunities are real, what they'll cost and what could go wrong, before capital is committed.
Infrastructure funds, developers, utilities, corporate owners, lenders and investment committees get a ranked, defensible answer with the evidence and confidence behind every option.
Who
- Infrastructure funds
- Developers & asset owners
- Lenders & credit committees
- Investment committees
Example questions
- Which of our three solar sites should we fund first?
- Is this 1.2 GW campus bankable with power by 2028?
- What could break our nuclear timeline, and how likely is it?
Use cases
01
Rank markets and sites on power availability, pricing, resource quality and competitive pressure, then find sites like your best-performing asset.
02
Screen zoning, environmental, geotechnical, flood, access, title and grid before committing to detailed studies, so the dead ends are removed first.
03
NPV, IRR, payback and sensitivity across sites, phasing, build-vs-lease and grid-vs-behind-the-meter alternatives, grounded in live market and energy-price data.
04
Interconnection queues, permitting pathways and regulatory timelines priced into the investment case, not discovered after it.
05
Flood, wildfire, seismic, heat and drought exposure at the return periods that matter for design, lending and insurance.
06
Every number carries its evidence trail — sources, tests and confidence intervals — so lenders and credit committees can see how it was produced.
07
Ranked options with confidence intervals, delivered as one insight pack: report, tables, charts and maps, ready for committee.
08
Satellite monitoring across the portfolio for change, encroachment and climate risk, with before-and-after evidence for regulators and rate cases.
1M–6M USD
estimated avoided feasibility and early-engineering spend per development programme (illustrative)
Source: Globeholder AI benchmark report →Hours, not months
from a capital question to a ranked, sourced decision
Worked examples for data centres, wind, solar, hydropower, transmission and power plants are in the engineering section above. See the worked examples →
One model on both sides of the table.
When the engineering team and the investment committee work from the same world model, the answer the engineers defend is the answer the investors fund.
Used across data centres, power and grid, renewables, water and telecom.
Bring us your hardest infrastructure decision.
We'll put the agents on it, live with your team, and show you a complete, defensible answer.