
Introduction
Most AI benchmarks measure response speed, penalize cost, and treat a tidy markdown summary as a successful result. But for high-stakes analytical work where a wrong answer carries real financial consequences, what actually matters is depth of reasoning, data fidelity, and output you can act on. In wind turbine siting specifically, the unit that matters is precision: a recommendation that lands within a few kilometres of a genuinely viable site is actionable, while one that is only broadly “in the right region” is not.
We built Globeholder AI’s Thinking Lab™ around those principles, and then we put it head to head with Anthropic’s Claude and OpenAI’s ChatGPT to see how the tradeoffs play out in practice.
Thinking Lab™ differs from the text-based models in a fundamental way. Rather than reasoning about wind and terrain from learned text, it performs Type-2 physical reasoning directly over geospatial data layers: Digital Elevation Model (DEM) terrain and slope rasters, satellite imagery and land-cover classification, and physically simulated wind-resource fields. The two text-based LLMs reason about the region from training-derived knowledge, while Thinking Lab™ reasons over what the land and atmosphere actually look like. This benchmark was designed to test whether that distinction shows up in measurable siting accuracy.
We started with the question of where to site new utility-scale wind turbine installations within a central New Mexico region of interest, an area with strong, well-characterized wind resources and an established fleet of operating turbines that serves as ground truth.
At a Glance: The Models
| Company | Product and Model | Notes |
|---|---|---|
| Globeholder.ai | Thinking Lab™ | Type-2 physical reasoning platform |
| Anthropic | Claude Opus 4.6 | Latest Claude family model |
| OpenAI | ChatGPT-5.4 | Latest GPT family model, deep research mode |
The Approach: Task Definition
To evaluate physical reasoning performance, we designed a task focused on optimal wind turbine site identification within a constrained, real-world region. Models were asked to:
Identify and rank optimal locations for new wind turbine installations by jointly analyzing wind resource, terrain and slope, ruggedness, land-use constraints, and accessibility. For each recommendation, explain the key drivers behind site selection.
Each model returned its top candidate locations as latitude and longitude coordinates, enabling direct spatial comparison against the reference fleet.
Study Area
The benchmark focuses on a central New Mexico study area, characterized by a high-density fleet of existing utility-scale installations and robust wind-resource profiles that provide a definitive ground truth for site identification:
- Latitudinal bounds: 33.8° N to 35.1° N
- Longitudinal bounds: -106.0° W to -104.9° W
Encompassing the primary wind corridor near Vaughn, Encino, and Corona, this domain includes 1,289 active turbines documented in the USWTDB V8.3. With a fleet centroid located near 34.46° N, -105.49° W, the region of interest serves as the spatial boundary for all model predictions. Each output was evaluated by calculating the Haversine distance from the predicted coordinates to the nearest validated turbine within these constraints.
Evaluation Methodology
To assess prediction quality, we used a distance-based accuracy benchmark grounded in real-world infrastructure:
- Reference turbine locations were drawn from the U.S. Wind Turbine Database (USWTDB V8.3), filtered to the region of interest (1,289 operating turbines).
- For each predicted point, we computed the Haversine great-circle distance to the nearest reference turbine.
- The primary accuracy measure is threshold-based hit-rate: the share of predictions falling within fixed radii of an operating turbine (5 km, 10 km, 20 km, 50 km). Short radii are the decision-relevant ones, since a 5 km hit corresponds to a site a developer could pursue.
- We additionally report standard distributional error metrics, namely Median, Mean Absolute Error (MAE), Root Mean Square Error (RMSE), and Standard Deviation, for completeness.
Thinking Lab™ generated its predictions by reasoning directly over physical data layers for the region: DEM-derived terrain elevation, slope and ruggedness; satellite-derived land-cover and land-use constraints; and physically simulated wind-resource fields. The two text-based models received the same task definition and bounding box and returned ranked coordinate lists from their internal reasoning. All three models were evaluated over an identical set of 120 candidate points each, against the same reference fleet, so the comparison is like for like.
Results: Precision Site Identification
The headline result is short-radius accuracy, meaning how often a model’s recommendation lands close enough to be acted on. This is where Thinking Lab’s Type-2 physical reasoning separates most clearly from the text-based models.
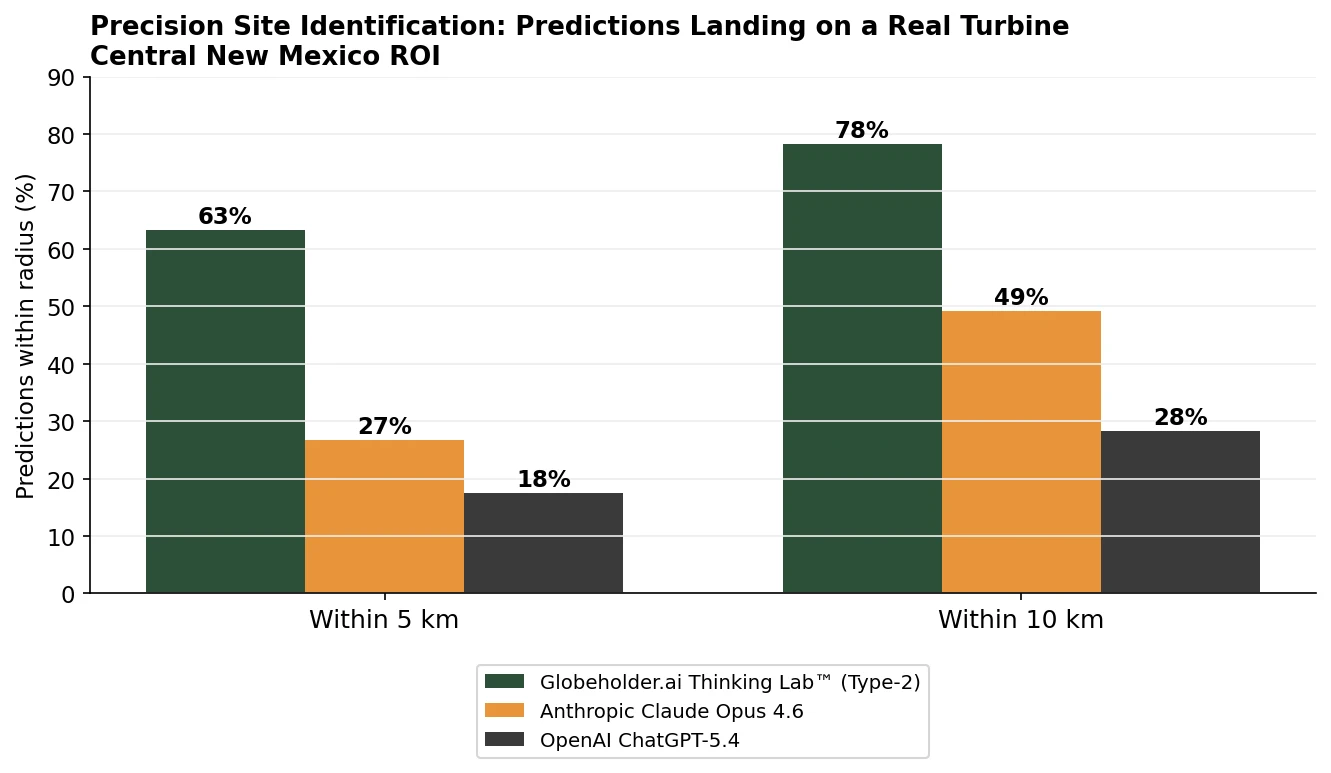
Within 5 km, Globeholder AI Thinking Lab™ placed 63% of its predictions directly on a real, operating turbine, more than double Anthropic Claude Opus 4.6 at 27% and roughly three times OpenAI ChatGPT-5.4 at 18%. Within 10 km the ordering holds: Thinking Lab™ reaches 78%, against 49% for Claude and 28% for ChatGPT. In the radius band that actually governs a siting decision, Thinking Lab™ is the only model placing the clear majority of its recommendations on viable ground.
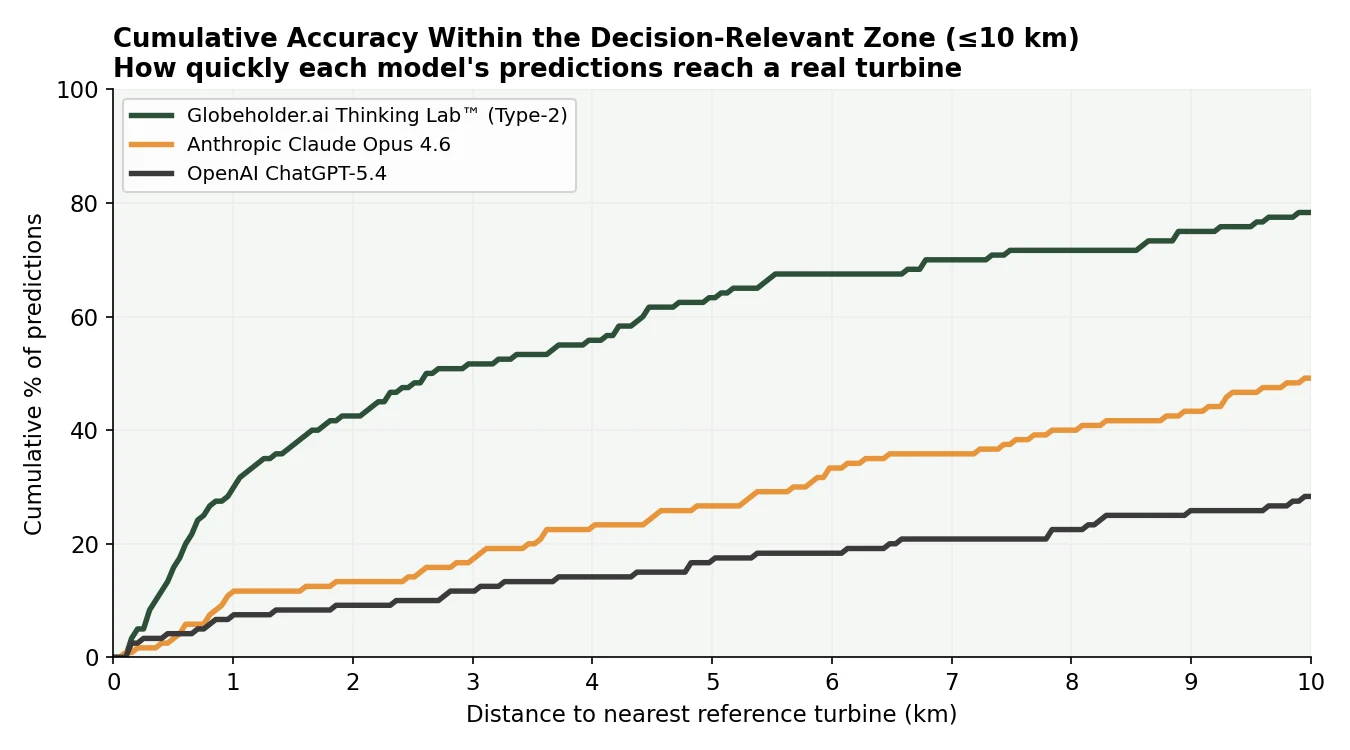
The cumulative accuracy curve makes the same point continuously. Across the entire decision-relevant zone up to 10 km, Thinking Lab’s curve sits well above both text-based models. It accumulates correct predictions fastest at every short radius, the range in which a recommendation remains practically useful for siting.
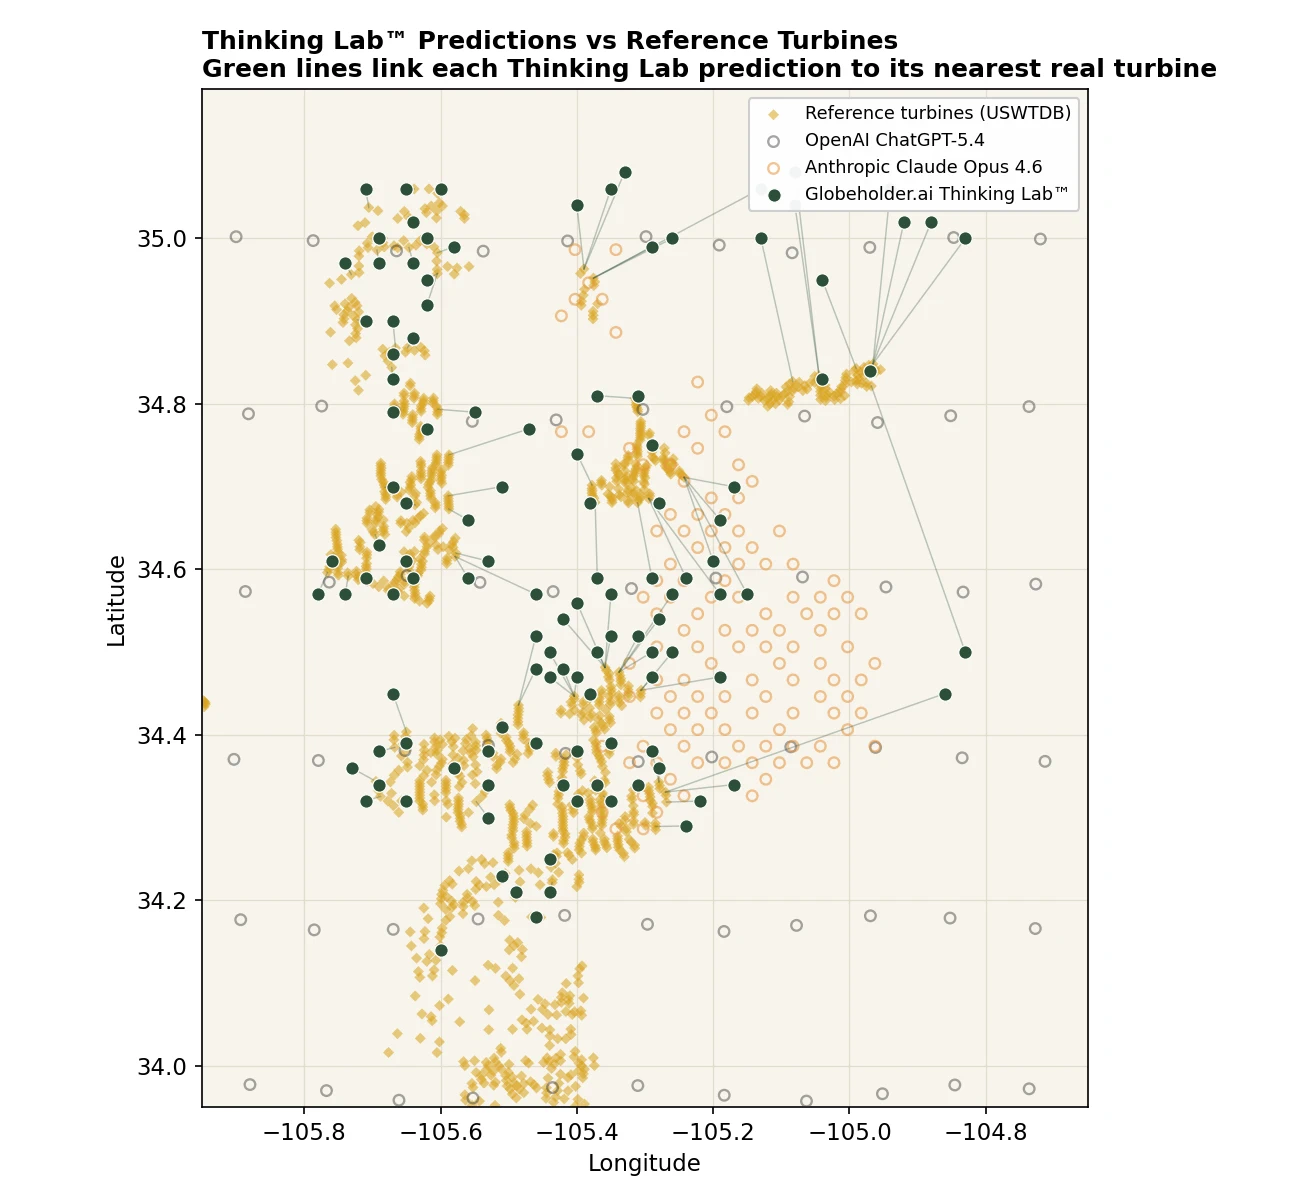
Spatial View: Where the Predictions Land
The map below plots the predictions over the operating turbine fleet. Each Thinking Lab™ point is joined to its nearest real turbine by a short connector line, so the shorter the line, the closer the prediction. Thinking Lab’s recommendations sit directly on the turbine clusters, with consistently short connectors. The text-based models, shown faded for contrast, drift away from the fleet: Claude’s points concentrate in open ground between clusters, and ChatGPT’s fall on an evenly spaced grid that largely ignores where turbines are.
Full Distance Benchmark
For completeness, the full set of distance metrics across all 120 candidate points per model is reported below.
| Metric | Thinking Lab™ | Claude Opus 4.6 | ChatGPT-5.4 |
|---|---|---|---|
| MAE (Mean) | 6.50 km | 11.84 km | 27.89 km |
| Median | 2.64 km | 10.19 km | 23.27 km |
| RMSE | 11.09 km | 14.64 km | 35.56 km |
| Std Dev | 8.99 km | 8.62 km | 22.05 km |
| Within 5 km | 76 / 120 | 32 / 120 | 21 / 120 |
| Within 10 km | 94 / 120 | 59 / 120 | 34 / 120 |
| Within 20 km | 110 / 120 | 95 / 120 | 55 / 120 |
| Within 50 km | 120 / 120 | 120 / 120 | 96 / 120 |
Thinking Lab™ leads on every accuracy metric in the table: lowest MAE (6.50 km), lowest median (2.64 km), lowest RMSE (11.09 km), and the highest hit-rate at every threshold, including a clean 120 of 120 within 50 km.
Top 10 Predicted Site Coordinates
| # | Thinking Lab™ | Claude Opus 4.6 | ChatGPT-5.4 |
|---|---|---|---|
| 1 | 34.50, -105.37 | 34.49, -105.20 | 33.36, -104.61 |
| 2 | 34.47, -105.44 | 34.53, -105.18 | 33.57, -104.60 |
| 3 | 34.52, -105.35 | 34.51, -105.22 | 33.77, -104.61 |
| 4 | 34.52, -105.31 | 34.55, -105.22 | 33.96, -104.62 |
| 5 | 34.97, -105.69 | 34.43, -105.24 | 34.16, -104.60 |
| 6 | 34.88, -105.64 | 34.51, -105.16 | 33.34, -104.73 |
| 7 | 34.45, -105.38 | 34.63, -105.22 | 33.56, -104.72 |
| 8 | 34.75, -105.29 | 34.57, -105.20 | 33.77, -104.72 |
| 9 | 34.92, -105.62 | 34.47, -105.14 | 33.97, -104.74 |
| 10 | 34.74, -105.40 | 34.45, -105.18 | 34.38, -104.60 |
Interpretation
This benchmark highlights a key distinction in model capabilities:
- Text-based reasoning models (Claude, ChatGPT) reason about a region from training-derived knowledge. They produce plausible, broadly correct placement, but their accuracy degrades at the short radii that govern an actual siting decision, most clearly in ChatGPT’s wide spread and weak 5 km hit-rate.
- Type-2 physical reasoning systems like Globeholder AI’s Thinking Lab™ reason over the data directly, using DEM terrain and slope, satellite land-cover, and simulated wind-resource fields. Integrating these layered physical signals produces precise, decision-grade site selection, which is exactly what the short-radius results demonstrate.
Conclusion
The results reflect a fundamentally different approach to answering where to place wind turbines. The text-based models returned ranked coordinate lists derived from reasoning about wind and terrain, while Globeholder AI’s Thinking Lab™ reasoned directly over physical data, using DEM terrain and slope, satellite land-cover, and simulated wind-resource fields, rather than about it.
The benchmark confirms the difference quantitatively, and it shows up exactly where it matters. In the 5 km band that governs an actionable siting decision, Thinking Lab™ placed 63% of its predictions on an operating turbine, well ahead of Claude (27%) and ChatGPT (18%), and led on median distance (2.64 km) and composite proximity score (92.8 of 100). The strength of the short-radius and median results, rather than a single lucky minimum, demonstrates consistent precision across the full candidate set, the kind of accuracy that turns a model output into a site a developer can pursue.
Business Impact: How Site Selection Accuracy Translates into ROI
In wind development, the cost of a wrong site is paid long before a turbine is ever built. Each candidate location that enters detailed feasibility carries real expense in survey work, wind measurement, environmental review, and engineering time. The more of those investigations that end on non-viable land, the more capital is spent reaching the same shortlist a more accurate screen would have produced on the first pass.
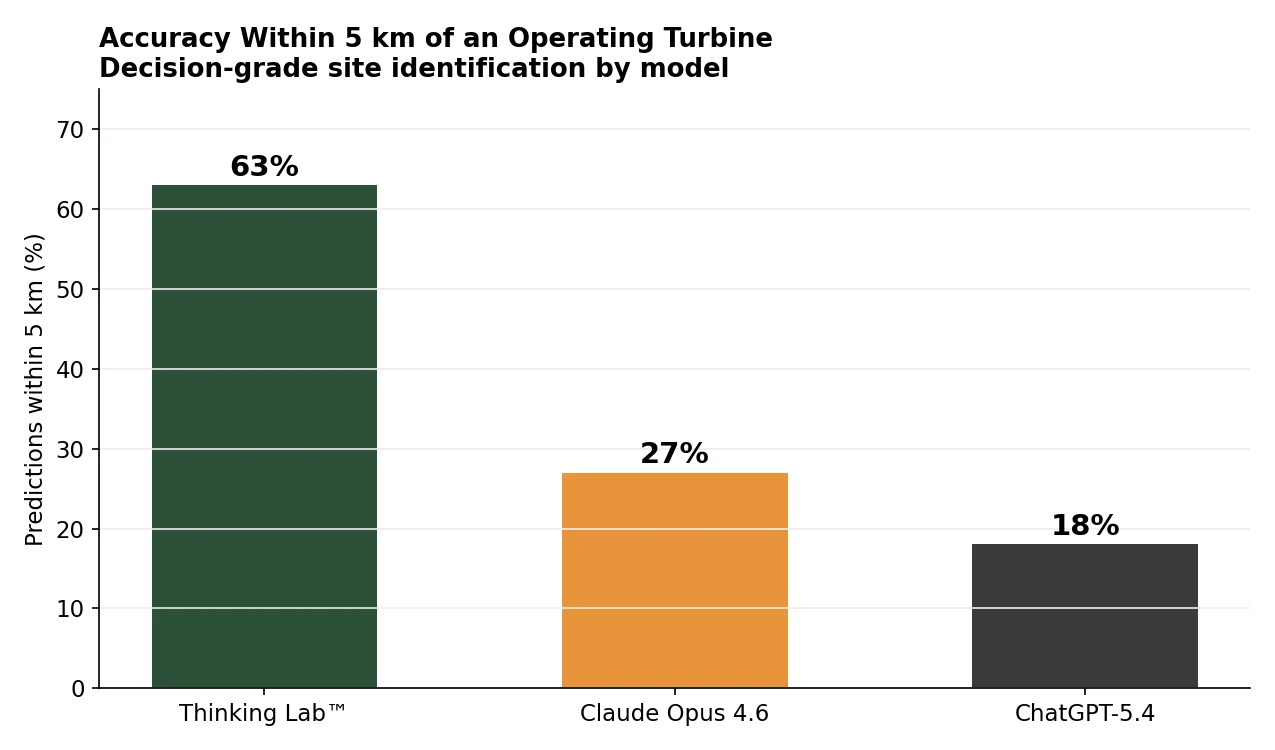
This is where the precision gap matters commercially. Thinking Lab™ placed 63% of its recommendations within 5 km of an operating turbine, against 27% for Claude and 18% for ChatGPT. Translated into a development pipeline, that difference means a far higher share of screened sites are genuinely worth pursuing, so teams spend their feasibility budget on locations that are likely to convert rather than on ground that looks plausible in a text-based answer but does not hold up against the physical data.
ROI KPIs at a Glance
| KPI | Thinking Lab™ | Business impact |
|---|---|---|
| Accuracy within 5 km | 63% | 2.3x to 3.5x more decision-grade opportunities than the text-based models |
| Median error | 2.64 km | Tighter screening and higher confidence before committing field resources |
| Accuracy within 10 km | 94 / 120 | More viable projects identified per evaluation cycle |
| Estimated savings | 1M to 6M USD | Lower feasibility and early engineering spend per development program |
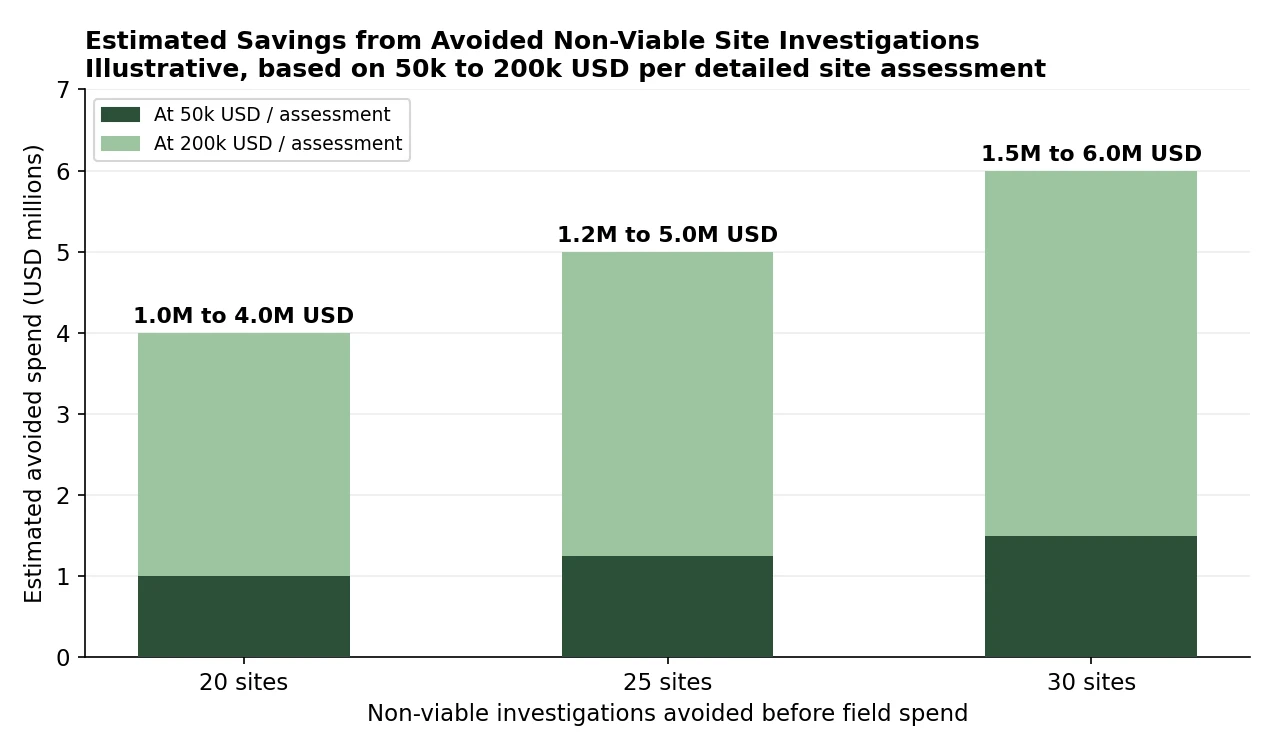
Putting the Savings in Context
Most developers spend somewhere between 50,000 and 200,000 USD to assess a single candidate site once it reaches detailed study. On a typical screening round, a less accurate model pushes a larger number of non-viable locations into that stage. If a more precise screen removes 20 to 30 of those dead-end investigations before money is committed, the avoided spend lands in the range of roughly 1 to 6 million USD across a development program. These figures are an illustrative model of the impact rather than a measured outcome, but the direction is clear: accuracy at the screening stage is one of the cheapest places in the entire development cycle to save capital.
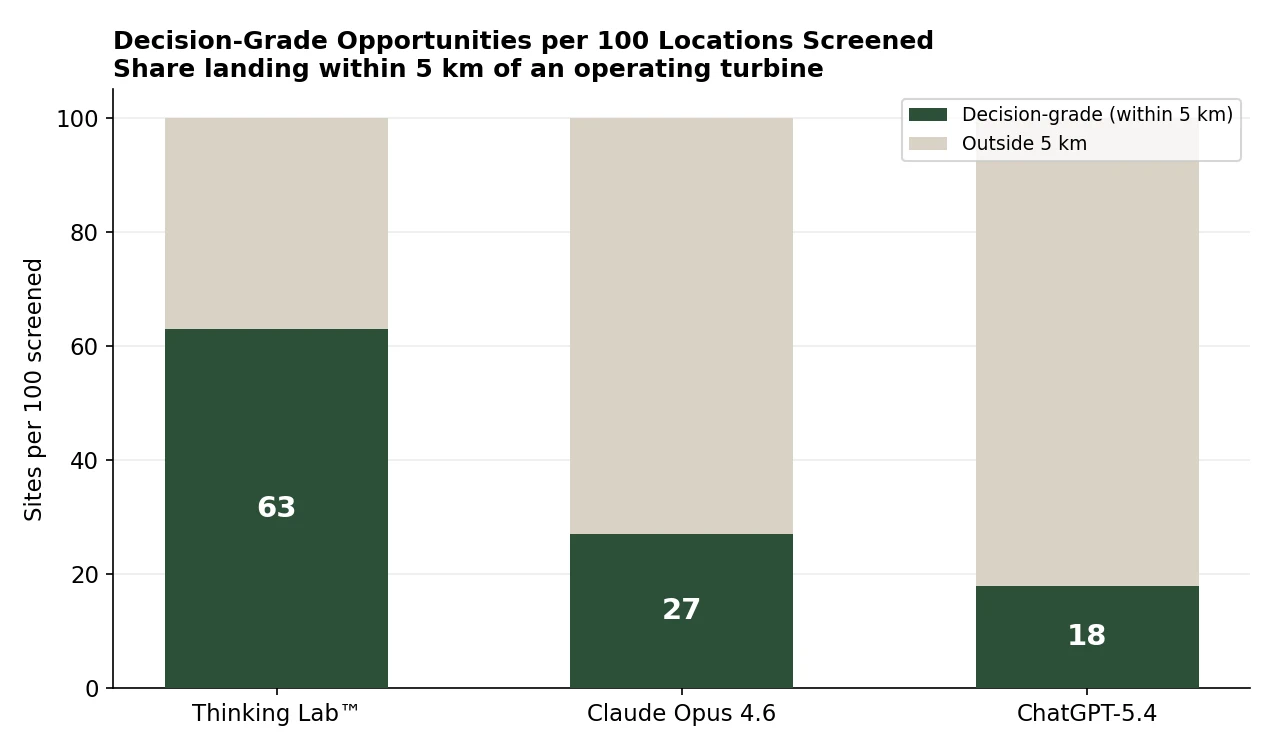
Opportunities Converted per 100 Sites Screened
The same accuracy advantage can be read as conversion. For every 100 locations screened, the share that lands within 5 km of an operating turbine is the share a developer can carry forward with confidence. Thinking Lab™ produces 63 such decision-grade candidates per 100, compared with 27 for Claude and 18 for ChatGPT.
Bottom Line
The benchmark points to a straightforward commercial case. By directing screening toward locations already validated by real-world turbine deployments, Thinking Lab™ helps a developer allocate capital where it is most likely to produce a buildable project. The precision shown here, especially at the short radii that decide whether a site is worth pursuing, is the part of the workflow where better model accuracy converts most directly into preserved budget and faster, more confident decisions.
Sign up for Globeholder AI’s Platform Access to our platform.