
Introduction
Most AI benchmarks measure response speed, penalize cost, and treat a tidy markdown summary as a successful result. But for high-stakes analytical work where a wrong answer carries real financial consequences, what actually matters is depth of reasoning, data fidelity, and output you can act on. In solar siting specifically, the unit that matters is precision: a recommendation that lands within a few kilometres of a genuinely viable site is actionable, while one that is only broadly “in the right region” is not.
We built Globeholder AI’s Thinking Lab™ around those principles, and then we put it head to head with Anthropic’s Claude, Google’s Gemini, OpenAI’s ChatGPT, and DeepSeek’s reasoning engine to see how the tradeoffs play out in practice.
Thinking Lab™ differs from the text-based models in a fundamental way. Rather than reasoning about solar resource and terrain from learned text, it performs Type-2 physical reasoning directly over geospatial data layers: Digital Elevation Model (DEM) terrain and slope rasters, satellite imagery and land-cover classification, and physically derived solar-irradiance fields. The text-based LLMs reason about the region from training-derived knowledge, while Thinking Lab™ reasons over what the land and atmosphere actually look like.
At a Glance: The Models
| Company | Product and Model | Notes |
|---|---|---|
| Globeholder.ai | Thinking Lab™ | Type-2 physical reasoning platform |
| Gemini 3.1 Pro | State-of-the-art Gemini model | |
| Anthropic | Claude Opus 4.6 | Latest Claude family model |
| OpenAI | ChatGPT-5.4 | Latest GPT family model, deep research mode on |
| DeepSeek | DeepSeek V3.2 Speciale | DeepSeek’s best reasoning model |
The Approach: Task Definition
To evaluate physical reasoning performance, we designed a task focused on optimal solar panel site identification within a constrained, real-world region. Models were asked to:
Identify and rank optimal locations for new solar panel installations by jointly analyzing solar radiation variability, topography, land-use constraints, and road accessibility. For each recommendation, explain the key drivers behind site selection.
Each model returned its top 10 candidate locations in GeoJSON format (latitude and longitude), enabling direct spatial comparison against the reference fleet.
Study Area
The benchmark focuses on a Southern California study area (Bakersfield, Kern County), characterized by an established fleet of operating utility-scale solar installations and robust solar-resource profiles that provide a definitive ground truth for site identification:
- Latitudinal bounds: 35.1° N to 35.8° N
- Longitudinal bounds: -120.2° W to -119.1° W
Each output was evaluated by calculating the Haversine distance from the predicted coordinates to the nearest validated solar installation within these constraints.
Evaluation Methodology
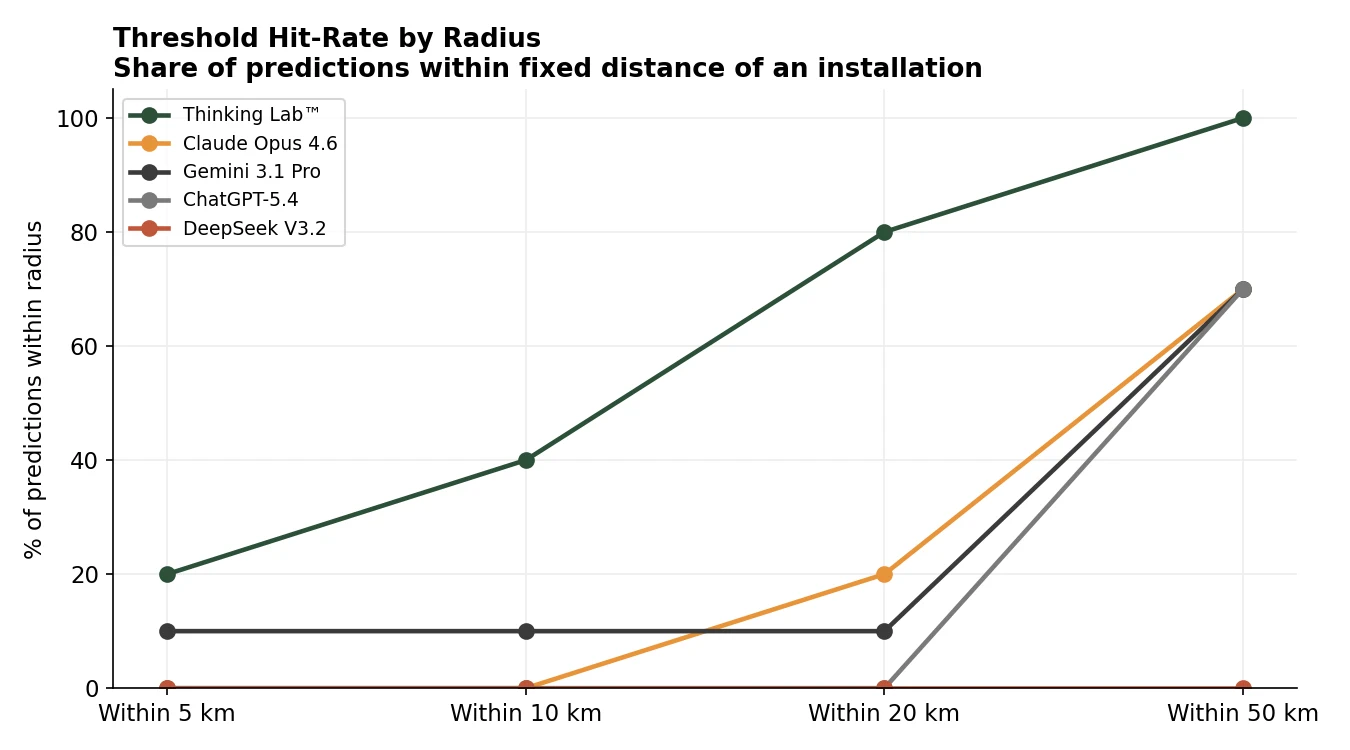
To assess prediction quality, we used a distance-based accuracy benchmark grounded in real-world infrastructure. A set of reference solar installation locations was curated within the region of interest. For each predicted point, we computed the Haversine great-circle distance to the nearest reference location. These distances were aggregated into standard error metrics: Mean Absolute Error (MAE), Median distance, Root Mean Square Error (RMSE), and Standard Deviation. We additionally evaluated threshold-based accuracy, measuring how many predictions fell within fixed radii (5 km, 10 km, 20 km, 50 km).
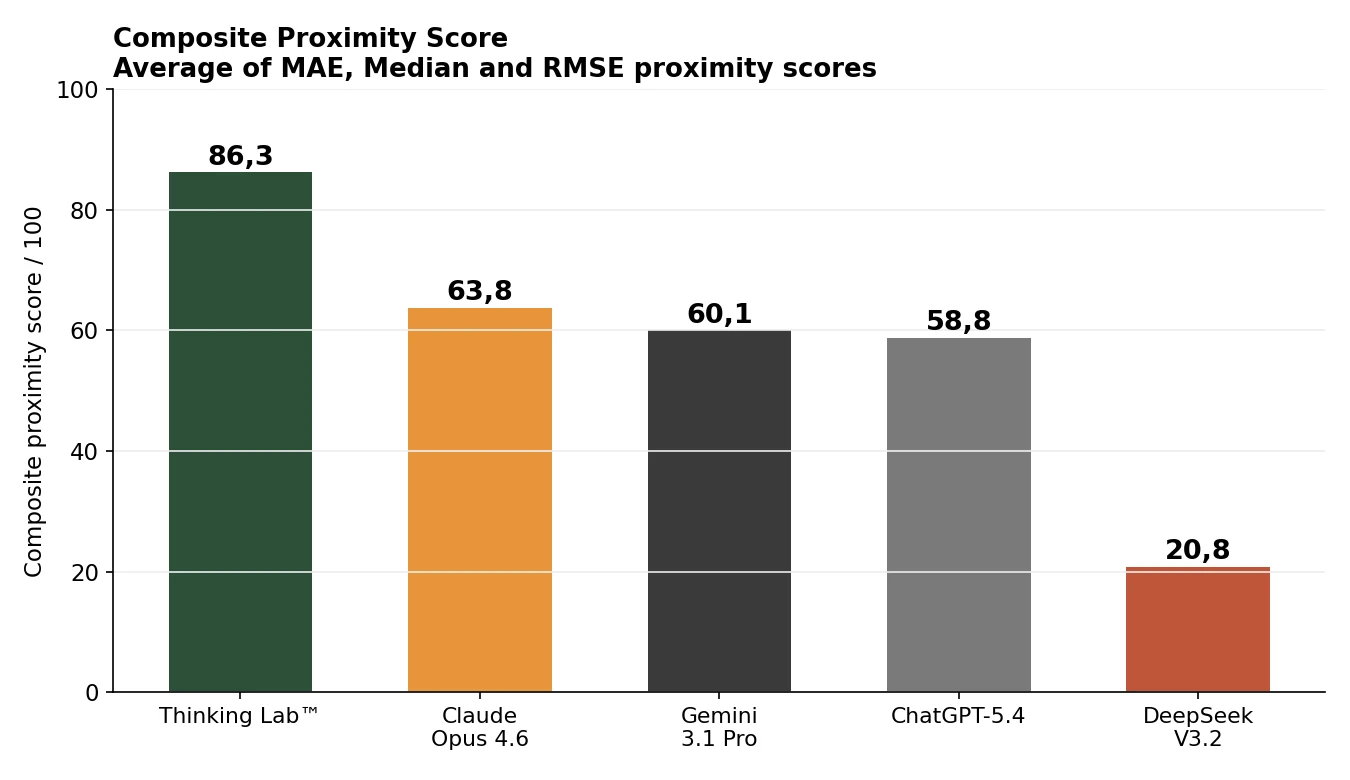
To make these results more intuitive for non-technical stakeholders, we also derived a Proximity Score for each error metric. Each model starts with a perfect score of 100, and every 1 km of prediction error subtracts 1 point (for example, an MAE of 12.30 km yields a Proximity Score of 87.70). A Composite Proximity Score, computed as the average of the MAE, Median, and RMSE proximity scores, provides a single summary figure per model. Higher values indicate predictions closer to real-world viable sites.
Results: Distance Benchmarking
Thinking Lab’s predictions are both accurate and tightly clustered around the reference fleet, evidenced by the best mean distance, lowest spread, and the highest number of sites located within every threshold radius.
| Metric | Thinking Lab™ | Claude Opus 4.6 | Gemini 3.1 Pro | ChatGPT-5.4 | DeepSeek V3.2 |
|---|---|---|---|---|---|
| MAE (Mean) | 12.30 km | 35.04 km | 38.44 km | 40.11 km | 79.08 km |
| Median | 14.53 km | 36.47 km | 39.80 km | 42.23 km | 78.78 km |
| RMSE | 14.36 km | 37.06 km | 41.49 km | 41.32 km | 79.62 km |
| Std Dev | 7.41 km | 11.88 km | 15.48 km | 9.26 km | 7.85 km |
| Within 5 km | 2 / 10 | 0 / 10 | 1 / 10 | 0 / 10 | 0 / 10 |
| Within 10 km | 4 / 10 | 0 / 10 | 1 / 10 | 0 / 10 | 0 / 10 |
| Within 20 km | 8 / 10 | 2 / 10 | 1 / 10 | 0 / 10 | 0 / 10 |
| Within 50 km | 10 / 10 | 7 / 10 | 7 / 10 | 7 / 10 | 0 / 10 |
Solar Farm Site Prediction Proximity Score
Bakersfield, California
Proximity Score of MAE: Thinking Lab™ scored 87.70 out of 100, meaning its predicted solar farm locations were on average only 12.3 km away from actual installations. The next best model, Anthropic Claude, scored 64.96 (35.0 km off). Thinking Lab’s recommendations land nearly three times as close to real-world viable sites compared to the competition.
Proximity Score of Median: Thinking Lab™ scored 85.47, the highest across all metrics. Half of its predictions fell within just 14.5 km of a real solar installation, compared with 63.53 for Anthropic Claude (36.5 km). The high median score confirms that Thinking Lab is consistently accurate, not just lucky on a few.
Proximity Score of RMSE: RMSE penalizes large misses more heavily. Thinking Lab™ scored 85.64 versus 62.94 for runner-up Claude, meaning it avoids wildly off-target suggestions. Models with large gaps between their MAE and RMSE scores are producing occasional extreme misses, while Thinking Lab maintains tight, reliable predictions throughout.
Composite Proximity Score
| Model | MAE Score | Median Score | RMSE Score | Composite |
|---|---|---|---|---|
| Globeholder.ai Thinking Lab™ | 87.70 | 85.47 | 85.64 | 86.3 |
| Anthropic Claude Opus 4.6 | 64.96 | 63.53 | 62.94 | 63.8 |
| Google Gemini 3.1 Pro | 61.56 | 60.20 | 58.51 | 60.1 |
| OpenAI ChatGPT-5.4 | 59.89 | 57.77 | 58.68 | 58.8 |
| DeepSeek V3.2 Speciale | 20.92 | 21.22 | 20.38 | 20.8 |
Globeholder.ai Thinking Lab™ achieved a composite proximity score of 86.3 out of 100, while Claude Opus 4.6, Gemini 3.1 Pro, and ChatGPT-5.4 scored 63.8, 60.1, and 58.8 respectively. DeepSeek V3.2 Speciale lagged well behind at 20.8, with all of its predictions falling outside the 50 km band.
Threshold Hit-Rate
Top 10 Predicted Site Coordinates
| # | Thinking Lab™ | Gemini 3.1 Pro | Claude Opus 4.6 | ChatGPT-5.4 | DeepSeek V3.2 |
|---|---|---|---|---|---|
| 1 | 35.33, -119.91 | 35.33, -119.96 | 35.16, -119.72 | 35.40, -119.47 | 35.35, -119.05 |
| 2 | 35.30, -119.89 | 35.61, -119.89 | 35.62, -119.95 | 35.60, -119.67 | 35.36, -119.04 |
| 3 | 35.28, -119.93 | 35.61, -119.69 | 35.31, -119.62 | 35.47, -119.52 | 35.37, -119.03 |
| 4 | 35.23, -119.95 | 35.30, -119.62 | 35.72, -119.35 | 35.47, -119.72 | 35.32, -119.09 |
| 5 | 35.36, -119.74 | 35.40, -119.46 | 35.61, -119.71 | 35.33, -119.66 | 35.28, -119.13 |
| 6 | 35.31, -119.71 | 35.15, -119.40 | 35.75, -120.10 | 35.20, -119.46 | 35.24, -119.16 |
| 7 | 35.22, -120.04 | 35.25, -119.35 | 35.72, -120.05 | 35.70, -119.59 | 35.20, -119.18 |
| 8 | 35.18, -119.74 | 35.59, -119.45 | 35.22, -119.44 | 35.58, -119.48 | 35.17, -119.21 |
| 9 | 35.33, -119.65 | 35.12, -119.38 | 35.42, -119.53 | 35.29, -119.39 | 35.13, -119.25 |
| 10 | 35.23, -119.64 | 35.65, -120.15 | 35.72, -120.05 | 35.15, -119.43 | 35.11, -119.27 |
Interpretation
This benchmark highlights a key distinction in model capabilities:
- Text-based reasoning models (Claude, Gemini, ChatGPT, DeepSeek) reason about a region from training-derived knowledge. They produce plausible, broadly correct placement, but their accuracy degrades at the short radii that govern an actual siting decision, most clearly in ChatGPT’s wide spread and DeepSeek’s systematic eastward drift.
- Type-2 physical reasoning systems like Globeholder AI’s Thinking Lab™ reason over the data directly, using DEM terrain and slope, satellite land-cover, and physically derived solar-irradiance fields. Integrating these layered physical signals produces precise, decision-grade site selection.
Conclusion
The results reflect a fundamentally different approach to answering where to place solar panel installations. Text-based reasoning engines returned ranked coordinate lists derived from reasoning about solar irradiance and land use, while Globeholder AI’s Thinking Lab processed actual satellite imagery and raster layers, reasoning directly over physical data rather than approximating it through text.
The benchmark confirms the difference quantitatively. Thinking Lab™ achieved a composite proximity score of 86.3 out of 100, outperforming Claude Opus 4.6 (63.8), Gemini 3.1 Pro (60.1), ChatGPT-5.4 (58.8), and DeepSeek V3.2 Speciale (20.8), with an MAE of just 12.30 km versus 35.04 km for the nearest competitor and the highest median proximity score (85.47) recorded across all metrics.
Business Impact: How Site Selection Accuracy Translates into ROI
In solar development, the cost of a wrong site is paid long before a panel is ever installed. Each candidate location that enters detailed feasibility carries real expense in survey work, irradiance measurement, environmental review, and engineering time. The more of those investigations that end on non-viable land, the more capital is spent reaching the same shortlist a more accurate screen would have produced on the first pass.
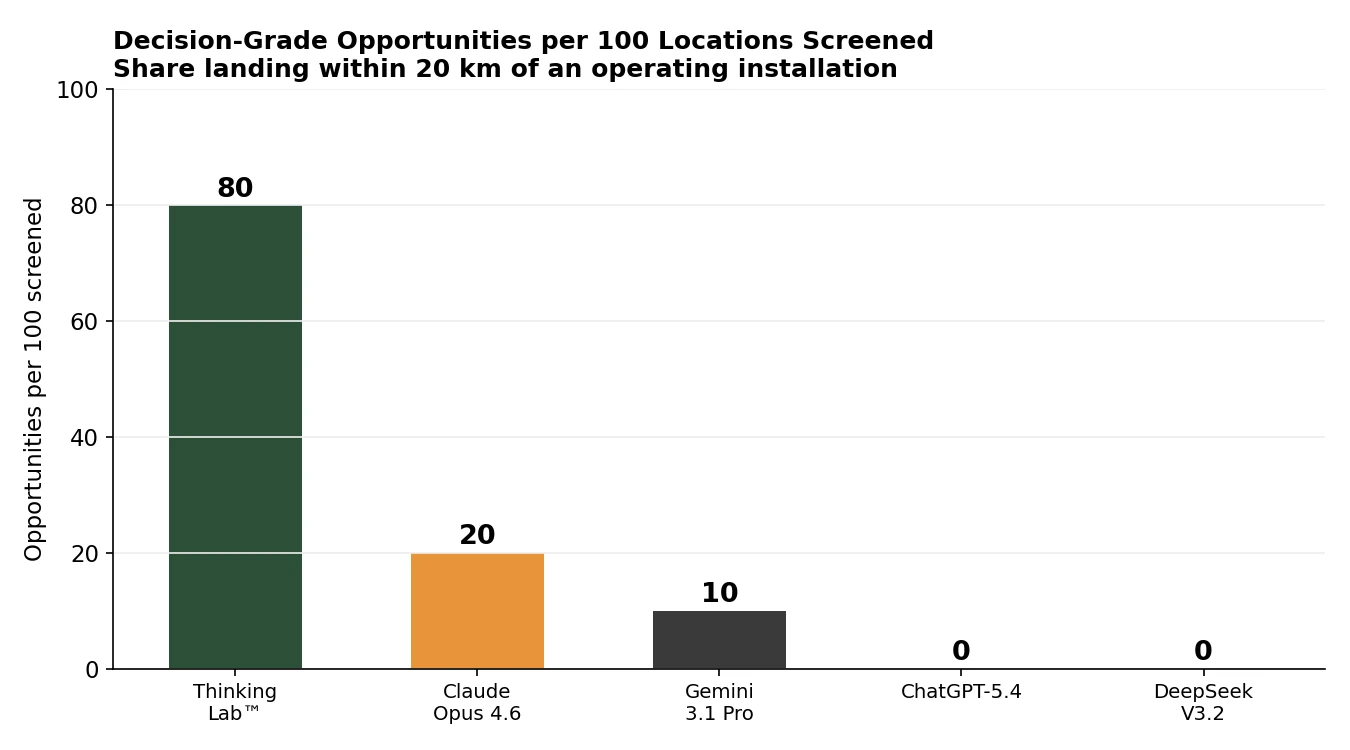
This is where the precision gap matters commercially. Thinking Lab™ placed 80% of its recommendations within 20 km of an operating installation, against 20% for Claude and 10% for Gemini. Teams spend their feasibility budget on locations that are likely to convert rather than on ground that looks plausible in a text-based answer but does not hold up against the physical data.
ROI KPIs at a Glance
| KPI | Thinking Lab™ | Business impact |
|---|---|---|
| Accuracy within 20 km | 80% | 4x more decision-grade opportunities than the text-based models |
| Median error | 14.53 km | Tighter screening and higher confidence before committing field resources |
| Accuracy within 50 km | 10 / 10 | Every recommendation falls inside the viable development zone |
| Estimated savings | 1M to 6M USD | Lower feasibility and early engineering spend per development program |
Putting the Savings in Context
Most developers spend between 50,000 and 200,000 USD to assess a single candidate site once it reaches detailed study. On a typical screening round, a less accurate model pushes a larger number of non-viable locations into that stage. If a more precise screen removes 20 to 30 of those dead-end investigations before money is committed, the avoided spend lands in the range of roughly 1 to 6 million USD across a development program. For utility-scale solar, grid interconnection adds a further dimension: each additional kilometre from an established corridor can represent 1M to 3M USD in construction cost, so screening toward proven sites compounds the savings. These figures are an illustrative model of the impact rather than a measured outcome, but the direction is clear: accuracy at the screening stage is one of the cheapest places in the entire development cycle to save capital.
Bottom Line
The benchmark points to a straightforward commercial case. By directing screening toward locations already validated by real-world solar deployments, Thinking Lab™ helps a developer allocate capital where it is most likely to produce a buildable project. The precision shown here, especially at the short radii that decide whether a site is worth pursuing, is the part of the workflow where better model accuracy converts most directly into preserved budget and faster, more confident decisions.
Sign up for Globeholder AI’s Platform Access to our platform.