
Introduction
Most AI benchmarks measure reward speed, penalize cost, and use a markdown summary as a successful result. But for high-stakes analytical work where a wrong answer has real financial consequences, what actually matters is depth of reasoning, data fidelity, and output you can act on.
We built Globeholder AI’s Thinking Lab™ around those principles, and then we put it head-to-head with Anthropic’s Claude, DeepSeek’s DeepThink, Google Gemini, and OpenAI’s ChatGPT reasoning engines to see how the tradeoffs played out in practice.
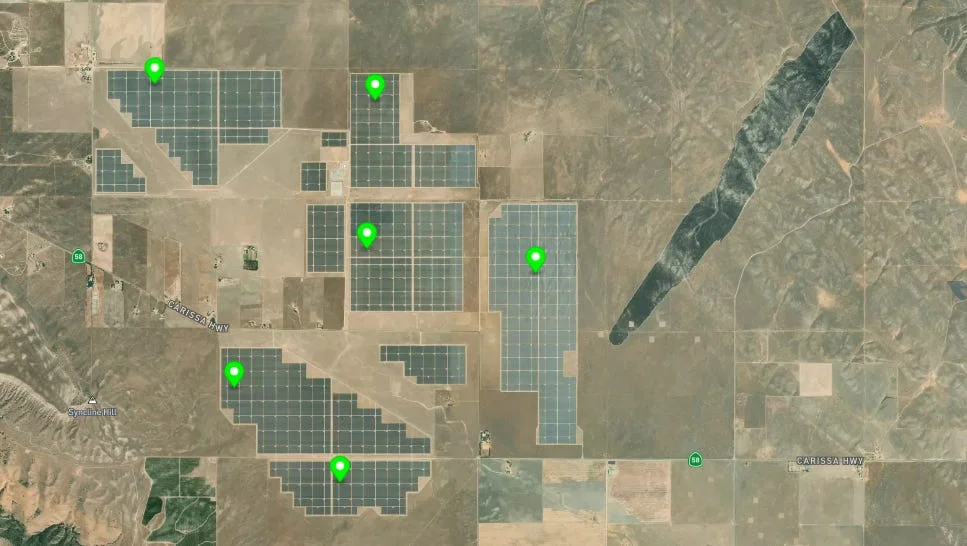
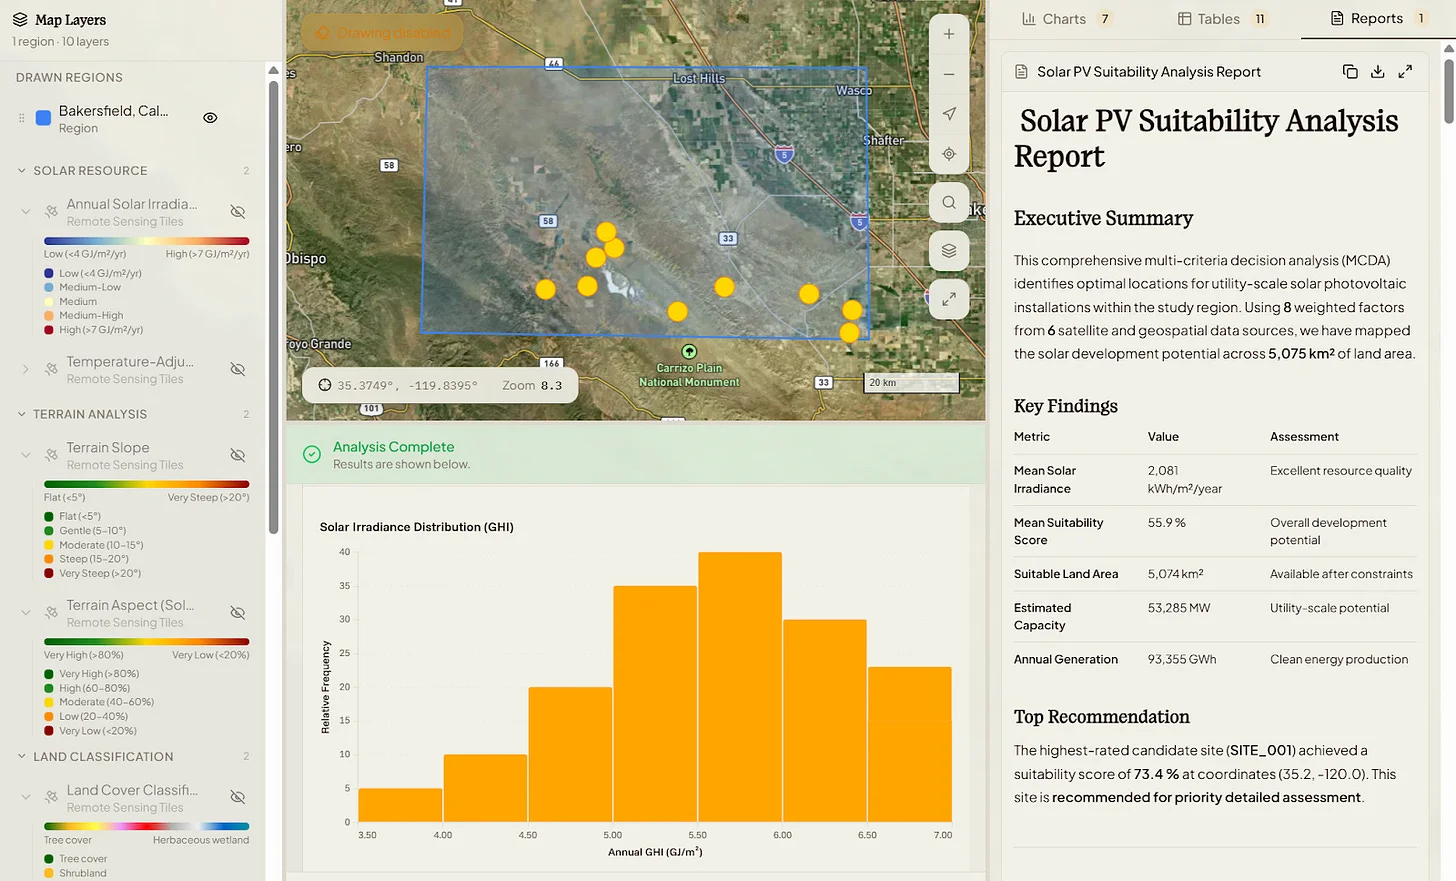
We started with the question and prompt to identify where to put new solar panel installations in Southern California, near Bakersfield in Kern County.
At a Glance: The Models
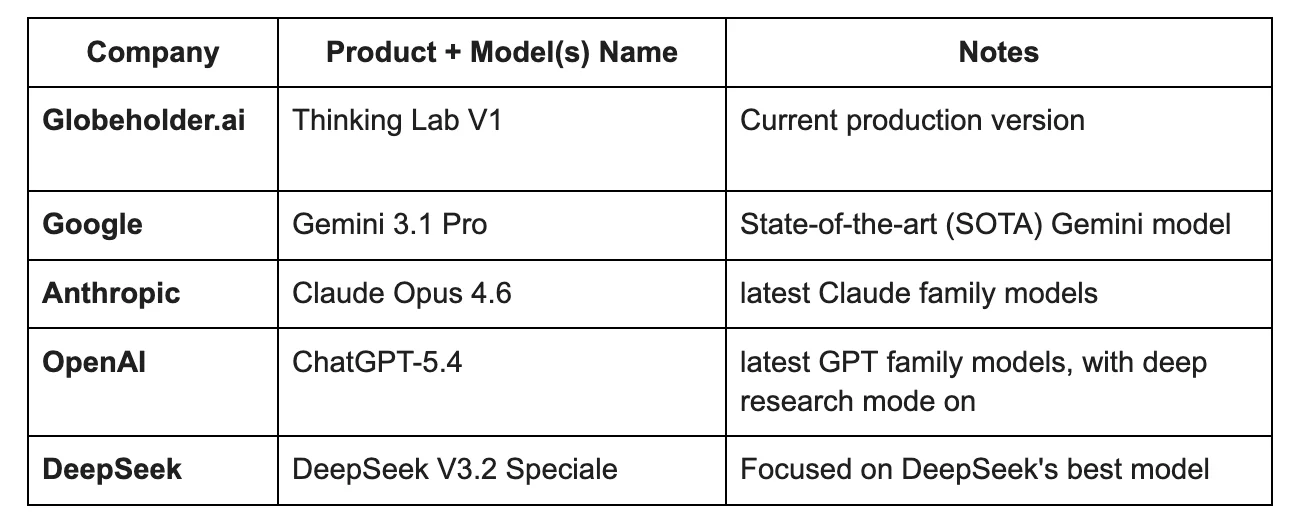
The Approach: Task Definition
To evaluate physical reasoning performance, we designed a task focused on optimal solar panel site identification in a constrained real-world region.
Models were asked to:
Identify and rank optimal locations for new solar panel installations by jointly analyzing solar radiation variability, topography, land-use constraints, and road accessibility. For each recommendation, explain the key drivers behind site selection.
The region of interest was defined as a bounding box in Southern California (Bakersfield area, in Kern County):
- Latitude: 35.1° N → 35.8° N
- Longitude: -120.2° W → -119.1° W
Models were required to return their top 10 candidate locations in GeoJSON format (latitude/longitude) enabling direct spatial comparison.
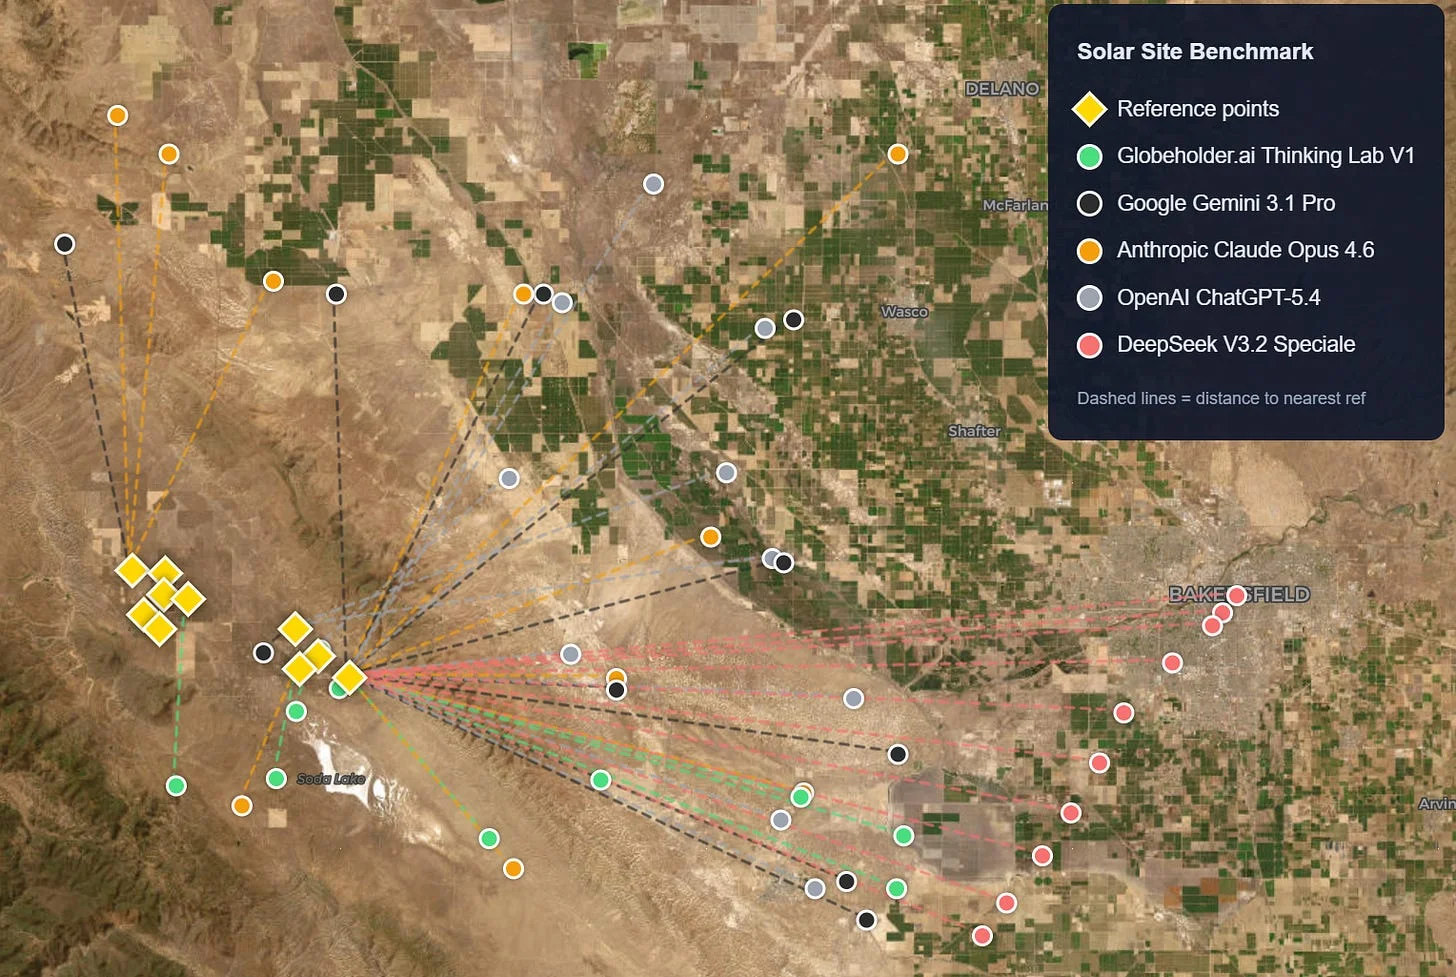
Evaluation Methodology
To assess prediction quality, we introduced a distance-based accuracy benchmark grounded in real-world infrastructure.
- A set of reference solar installation locations was manually curated within the region.
- For each predicted point, we computed the distance to the nearest reference location.
- These distances were then aggregated into standard error metrics:
- Mean Absolute Error (MAE)
- Median distance
- Root Mean Square Error (RMSE)
- Standard deviation
- We additionally evaluated threshold-based accuracy, measuring how many predictions fell within fixed radii (e.g., 5 km, 10 km, 50 km).
To make these results more intuitive for non-technical stakeholders, we also derived a Proximity Score for each error metric. Each model starts with a perfect score of 100, and every 1 km of prediction error subtracts 1 point (e.g., an MAE of 21.38 km yields a Proximity Score of 78.62). A Composite Proximity Score, computed as the average of the MAE, Median, and RMSE proximity scores, provides a single summary figure per model. These scores are presented in the accompanying bar charts, where higher values indicate predictions closer to real-world viable sites.
This approach provides a proxy for practical site selection quality, assuming that proximity to existing installations reflects underlying suitability (e.g., solar irradiance, grid access, and land feasibility).
Results: Distance Benchmarking
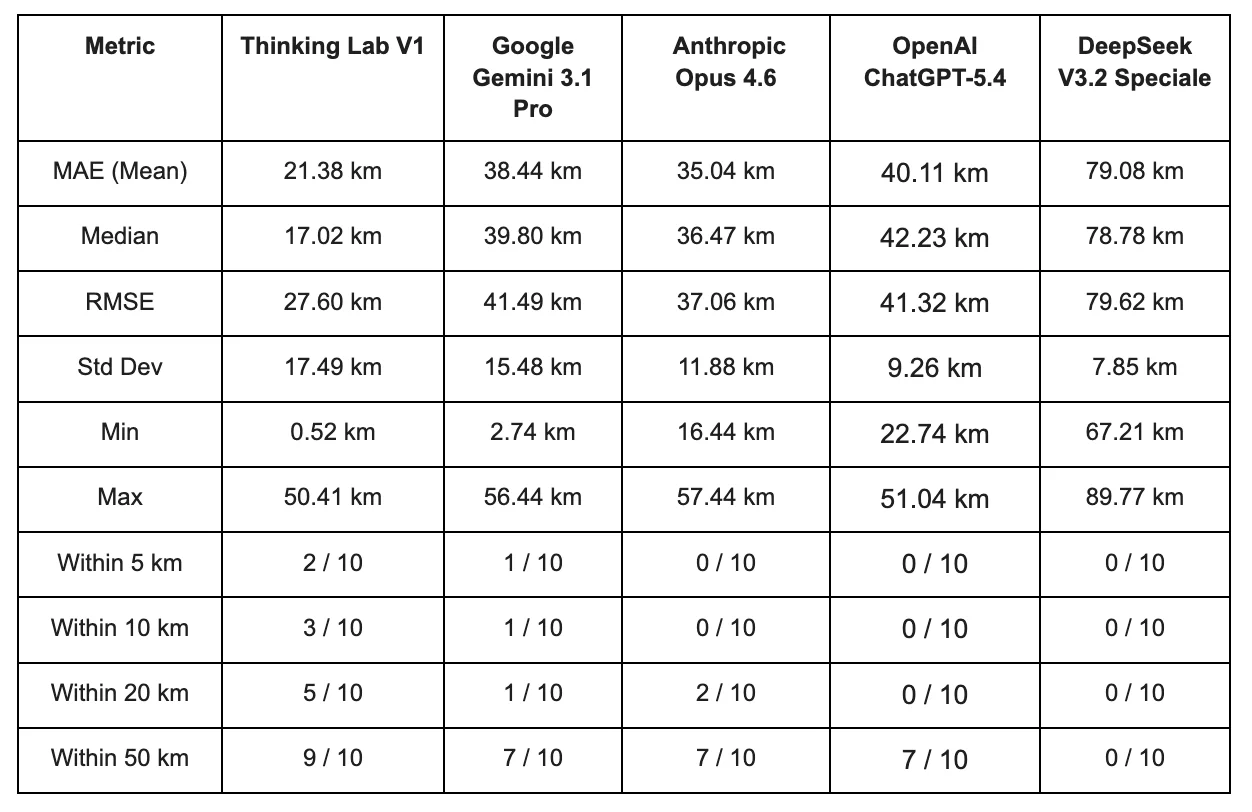
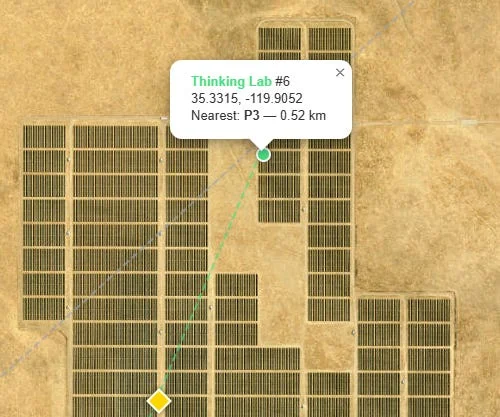
Its predictions are both accurate and tightly clustered around the reference, evidenced by the best mean distance, lowest spread, and the highest number of sites located within 50 km.
Solar Farm Site Prediction Proximity Score of MAE, Median and RMSE
Bakersfield, California
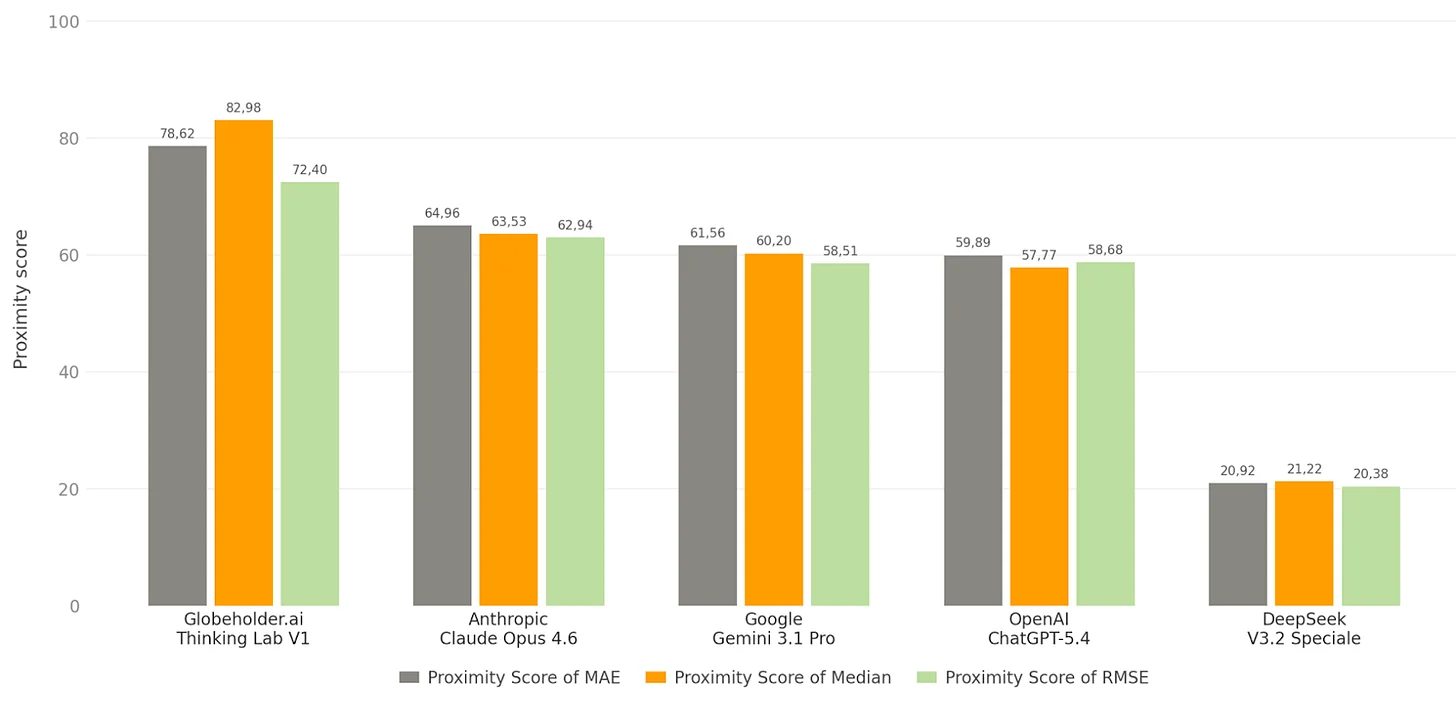
Proximity Score of MAE (Mean Absolute Error): Thinking Lab scored 78.62 out of 100, meaning its predicted solar farm locations were on average only 21.4 km away from actual installations. The next best model, Anthropic Claude, scored 64.96 (35.0 km off). Thinking Lab’s recommendations land nearly twice as close to real-world viable sites compared to the competition.
Proximity Score of Median: Thinking Lab scored 82.98, the highest across all metrics. This means half of its predictions fell within just 17.0 km of a real solar installation, compared to 63.53 for Anthropic Claude (36.5 km). The high Median score confirms that Thinking Lab is consistently accurate across predictions, not just lucky on a few.
Proximity Score of RMSE (Root Mean Square Error): RMSE penalizes large misses more heavily than small ones. Thinking Lab scored 72.40 versus 62.94 for the runner-up Anthropic Claude, meaning it not only predicts well on average but also avoids wildly off-target suggestions. Models with large gaps between their MAE and RMSE scores are producing occasional extreme misses, while Thinking Lab maintains tight, reliable predictions throughout.
Solar Farm Site Prediction Composite Proximity Score of MAE, Median and RMSE
Bakersfield, California
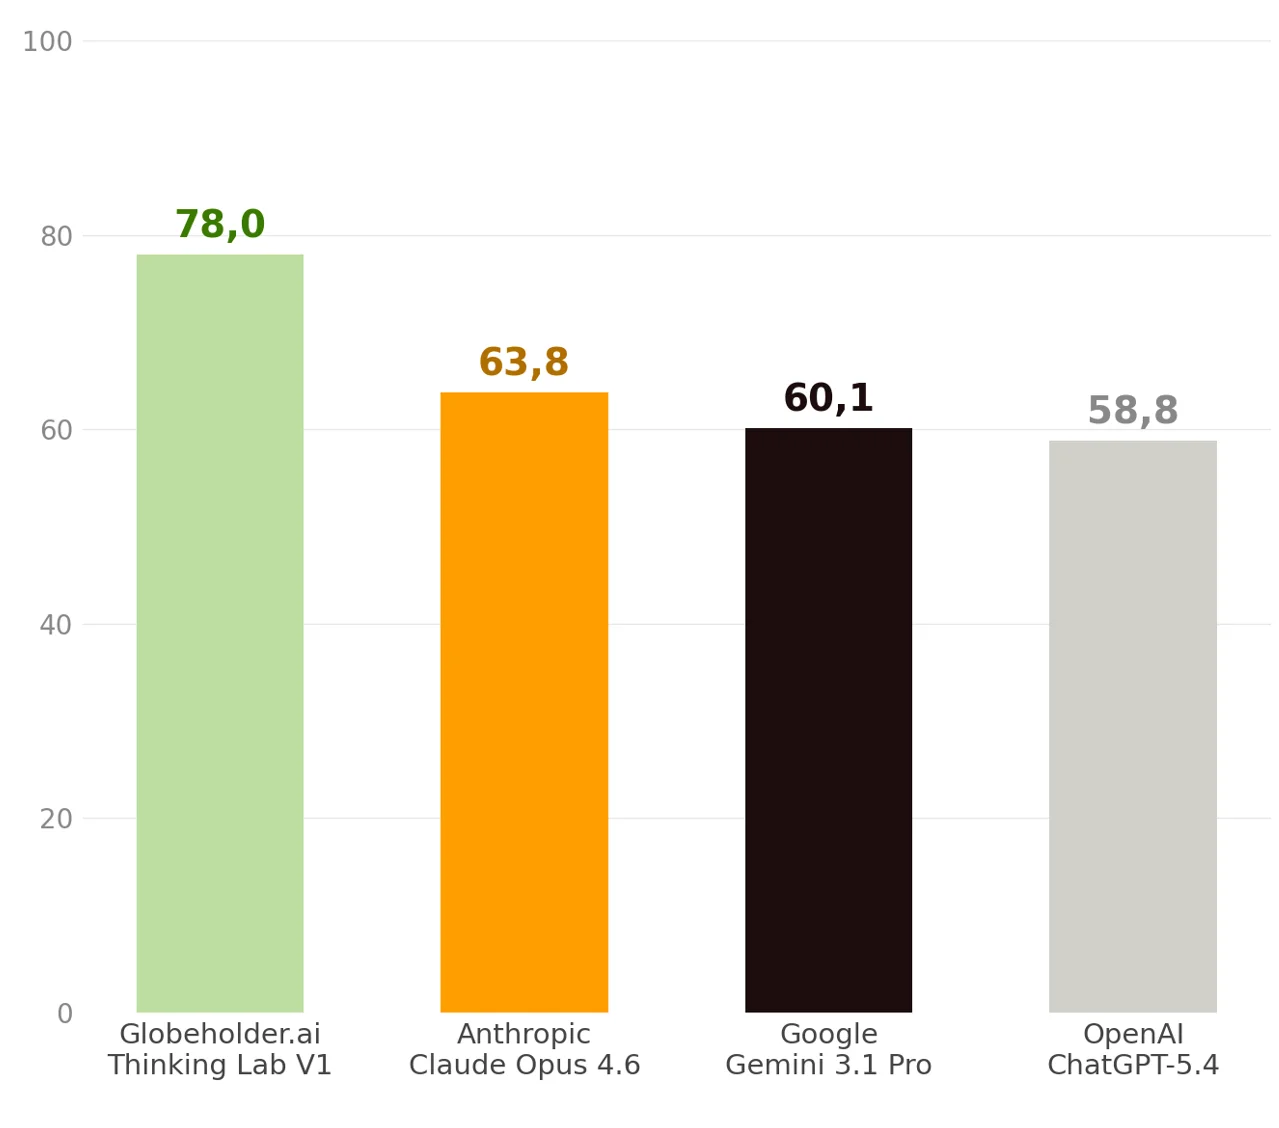
Globeholder.ai Thinking Lab V1 achieved a composite proximity score of 78.0 out of 100, while Anthropic Claude Opus 4.6, Google Gemini 3.1 Pro, and OpenAI ChatGPT-5.4 scored 63.8, 60.1, and 58.8 respectively. Thinking Lab’s predictions landed nearly twice as close to real solar installations.
Interpretation
This benchmark highlights a key distinction in model capabilities:
- Surface-level reasoning models tend to rely on coarse signals (e.g., general climate or region-level assumptions), leading to broad but imprecise placement.
- Multi-step reasoning systems like Globeholder AI’s Thinking Lab integrate layered signals including terrain, infrastructure proximity, and land constraints which results in a more realistic site selection.
Conclusion
The results reflect a fundamentally different approach to answering where to place solar panel installations. Text-based reasoning engines returned ranked coordinate lists derived from reasoning about solar irradiance and land use, while Globeholder AI’s Thinking Lab processed actual satellite imagery and raster layers, reasoning directly over physical data rather than approximating it through text. The benchmark confirms this: Thinking Lab V1 achieved a composite proximity score of 78.0 out of 100, outperforming Anthropic Claude Opus 4.6 (63.8), Google Gemini 3.1 Pro (60.1), and OpenAI ChatGPT-5.4 (58.8), with an MAE of just 21.38 km versus 35.04 km for the nearest competitor and the highest Median proximity score (82.98) recorded across all metrics.
This 15% accuracy advantage translates directly into development economics: fewer failed site assessments ($50K–$200K saved per discarded candidate), faster permitting near established solar corridors, and lower grid interconnection costs where each additional kilometer can represent $1M–$3M in utility-scale construction. Better physical reasoning does not just improve a benchmark score; it compresses the development cycle and strengthens project bankability from day one.
Sign up for Globeholder AI’s Early Access to our platform.